Continued Signs of Market Stabilization
As we move further into the spring market, the Fraser Valley housing market is continuing to show early signs of stabilization, with sales activity improving and benchmark prices increasing for a second consecutive month.
Though sales activity is increasing, the Fraser Valley still remains firmly in a buyer's market, with an overall sales-to-active listings ratio of 11 per cent in April. A balanced market is typically defined by a ratio between 12 and 20 per cent.
A total of 1118 homes sold in April, an increase of 11% from March, and 7% above the same month last year.

Across the Fraser Valley
Across the Fraser Valley there were 1118 homes sold in April, an increase from both the previous month, and the same month last year.
Sellers continued to enter the spring market, with new listings rising 6% from March to 3,549 - still above seasonal norms, but lower than this time last year.
Average Days on Market in April:
• Detached Homes: 37 days
• Townhomes: 32 days
• Condos: 42 days
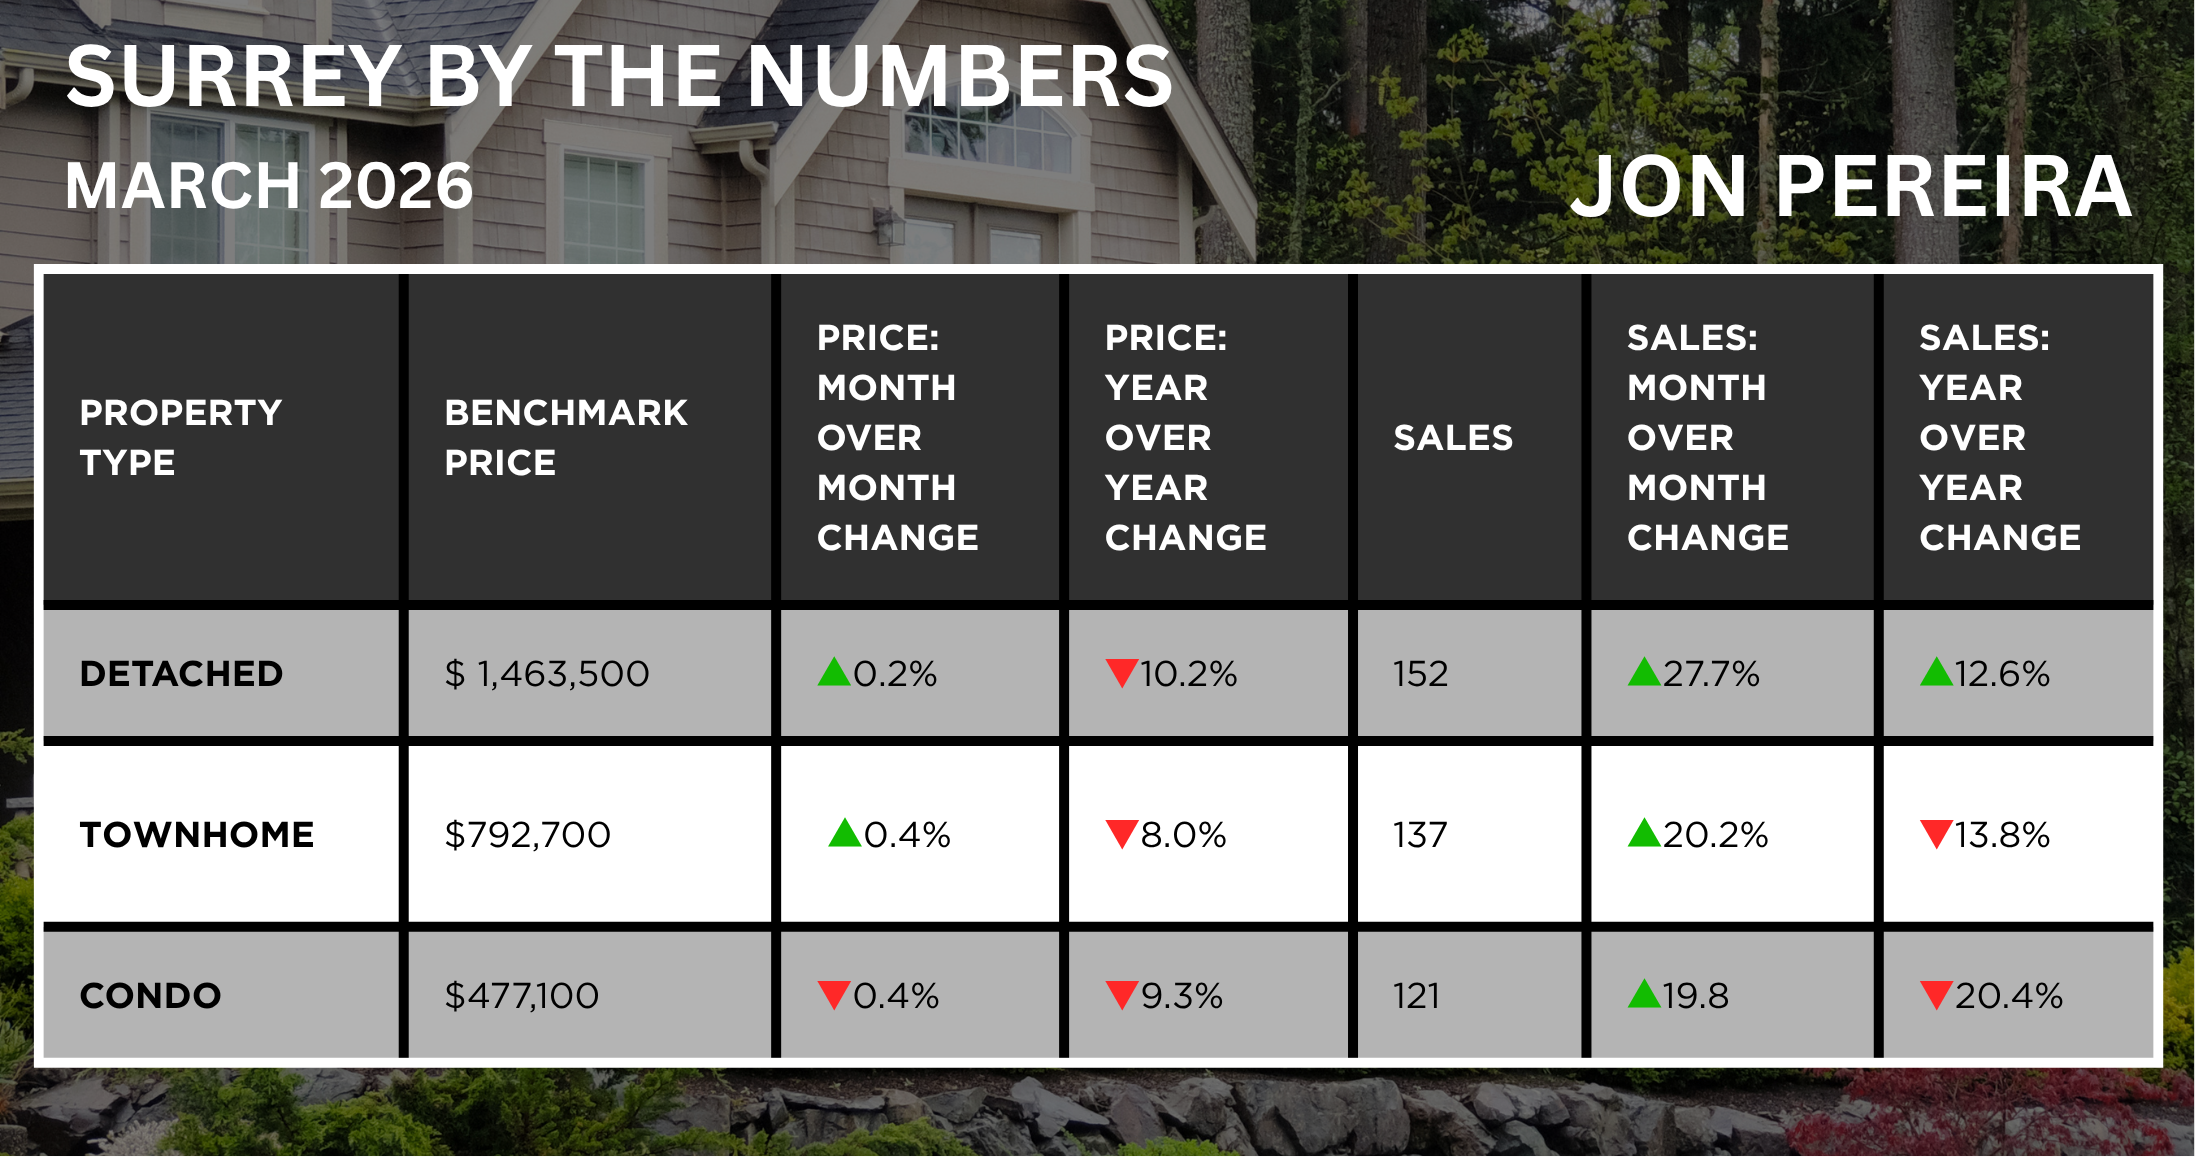
A Closer Look at Surrey
Surrey’s housing market continued to show mixed trends in April, with sales activity improving across most property types while benchmark prices remained relatively stable month-over-month.
Detached home sales increased 21.7% from March and 22.5% compared to April of last year, with the benchmark price sitting at $1,461,000 - down 0.2% month-over-month and 9.8% year-over-year.
Townhomes continued to show relative stability, with benchmark prices increasing 0.2% from March to $794,500. Sales activity also improved, rising 13.1% month-over-month and 2.6% year-over-year.
The condo market remained softer compared to other property types. Benchmark prices declined 0.6% month-over-month to $474,100 and were down 9.1% year-over-year. However, condo sales still increased 5.0% from March, despite remaining 31.0% below April 2025 levels.